Navigating the Fed's Pivot and Recession: A Comprehensive Guide
When will the Fed pivot? Next month? Next year? In 3 years?
Table of Contents
- What is a Fed Pivot?
- What is the Federal Funds Rate?
- What Would Cause a Fed Pivot?
- What is the Fed Waiting For?
- Did the Fed Already Pivot?
- What Indicators is the Fed Watching?
- What is the Fed's Job?
- Is a Fed Pivot Bullish?
- What is a Recession?
- Are We in a Recession?
- How Bad Could a Recession Get?
- Are Recessions Bad?
- How to Invest in this Economy
"We have involved ourselves in a colossal muddle, having blundered in the control of a delicate machine, the working of which we do not understand. The result is that our possibilities of wealth may run to waste for a time–perhaps for a long time." – John Maynard Keynes, The Great Slump of 1930
What is a Fed Pivot?
A pivot by the Federal Reserve (Fed), refers to a change in the central bank's policy stance. The Fed can either stimulate the economy or tighten economic conditions by setting the target range for the Federal Funds rate, conducting open market operations, adjusting reserve requirements, using discount window lending, and giving forward guidance (communicating its policy plans publicly).
What is the Federal Funds Rate?
The Federal Funds rate is a key interest rate that determines the cost for banks to lend and borrow reserve balances, which are funds held at the Federal Reserve, from each other overnight. The Fed can adjust the supply and demand of these reserve balances to influence the Federal Funds rate and other interest rates in the economy. By raising or lowering the Federal Funds target rate, the Fed can either stimulate or slow down economic growth, depending on its goals.
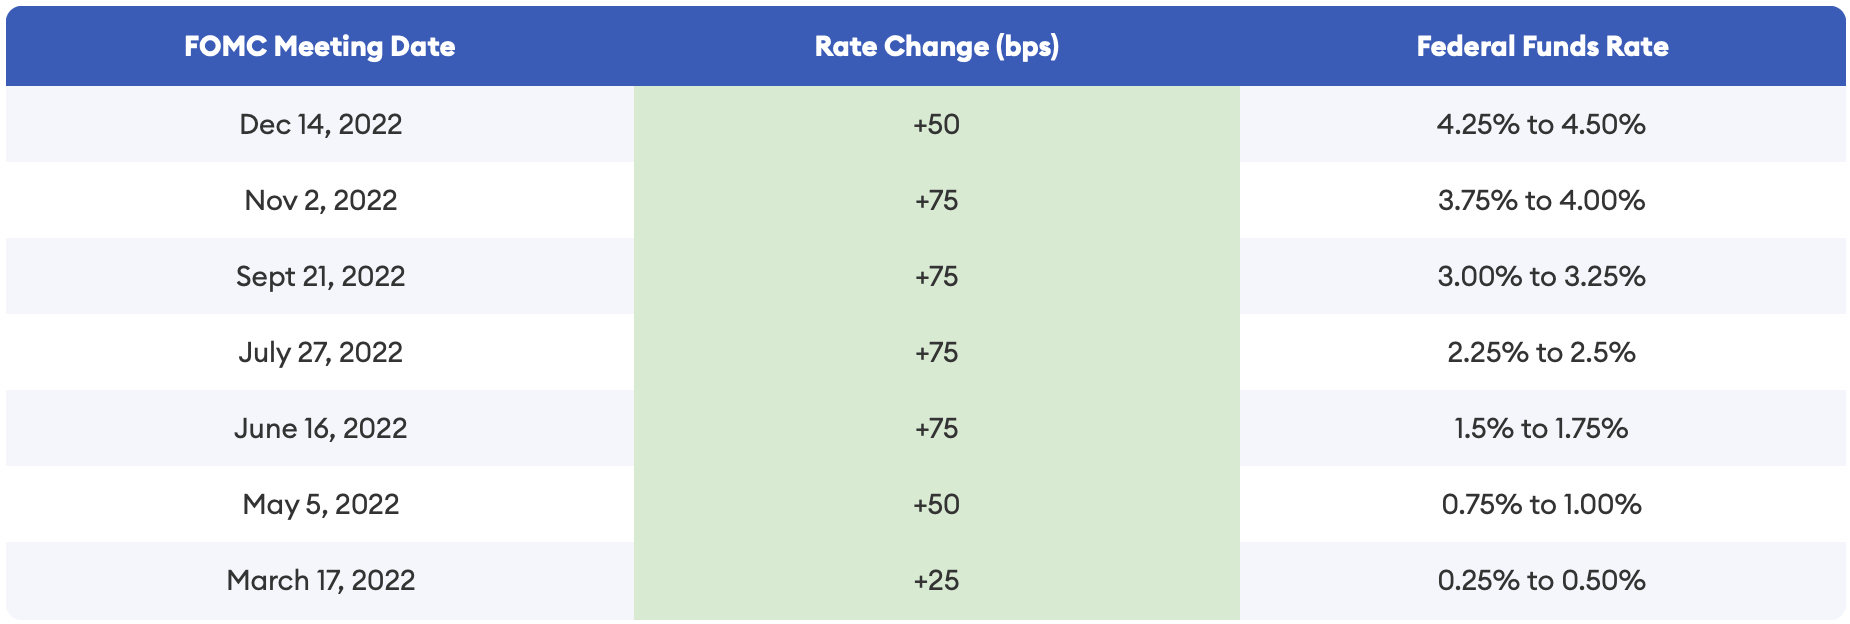
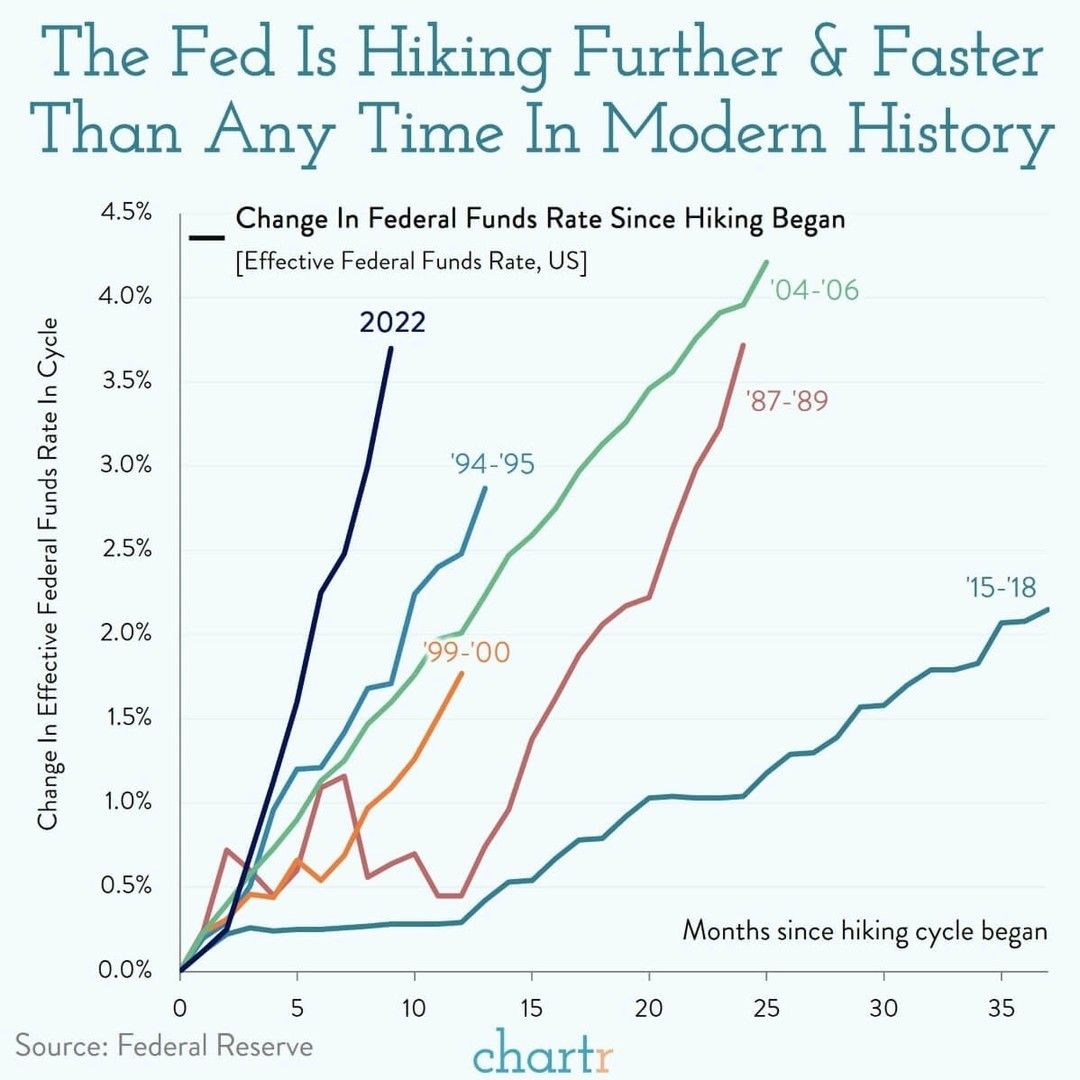
On March 15, 2020, in response to the economic impact of the COVID-19 pandemic, the Federal Reserve (Fed) reduced the federal funds rate to 0% in order to prevent an economic crisis. This was the lowest the federal funds rate had been since 2008. The combination of pandemic-related supply chain disruptions, pent-up consumer demand, historically low unemployment, and financial market conditions contributed to a surge in U.S. economic activity in 2021, resulting in an increase in prices. Initially, Fed officials believed that inflation was transitory and would resolve on its own as the economy recovered. However, by early 2022, it became evident that inflation was worse than expected. As a result, the Fed began to gradually raise interest rates in March 2022, starting with a 25 basis points (bps) increase. This shift in strategy marked a change from a loose monetary policy to a tight monetary policy. From June to November 2022, the Fed has consistently raised rates by 75 bps at each meeting. These increases are the highest since 1994.
What Would Cause a Fed Pivot?
Analysts have proposed several theories on what might cause a Fed pivot:
- The Treasury
- Debt to GDP
The Treasury
The theory is that the Fed, being a non-profit organization, typically remits its profits to the U.S. Treasury every year. However, this year the Fed has no profits to give to the Treasury, so the Treasury will not receive the ~$90 billion it likely expected. Even though the Fed is an independent institution, it can still be influenced by the U.S. government. To help the Treasury, the Fed could use open market operations (OMOs) to increase demand for securities, such as Treasury bonds, by buying them from the market. This would cause their price to rise and their yield to decrease. The Treasury could then sell new bonds to the Fed at the higher price, effectively receiving an inflow of funds from the Fed.
In recent years, the Federal Reserve has typically remitted tens or hundreds of billions of dollars to the Treasury each year. In 2020, for instance, the Federal Reserve remitted a total of $91.5 billion to the Treasury, while in 2019, it remitted a total of $79.6 billion. These figures represent the net income of the Fed after deducting operating expenses and dividends paid to member banks.
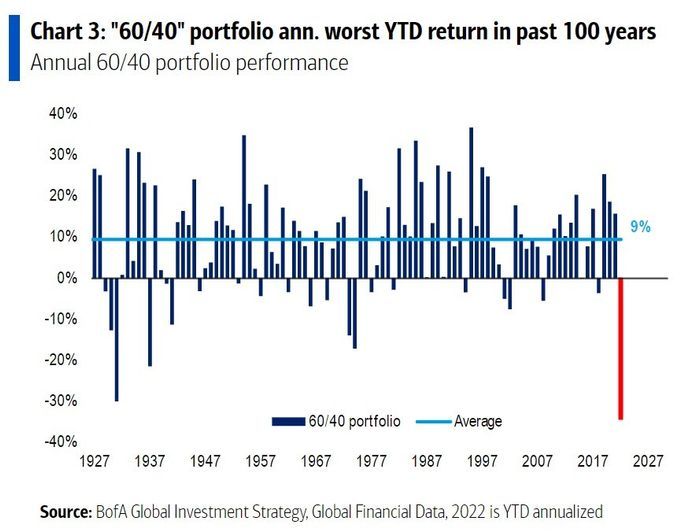
Bonds have generally been seen as a reliable way to hedge against risk since 1980. However, in 2022, bonds experienced their worst decline in over a century, resulting in a 60/40 stock and bond portfolio returning -34.4% (Figure 3). The Fed has a huge bond position that is negative. This is why the Fed will not have any profits to remit to the Treasury this year.
The Federal Reserve's remittance to the Treasury is an important source of revenue for the U.S. government, and it has contributed significantly to the reduction of the federal budget deficit in recent years.
The Treasury does have other forms of income, like tax revenue, fees, and fines. However, typically all of its tax revenue is used to pay for social welfare and debt interest payments, so all other fiscal spending will have to come from fees and fines.
One could make the argument that the Fed's remittance isn't very important to the Treasury. If the Treasury needs additional money, the government can borrow from foreign governments or financial markets, but this would further increase the U.S. debt. In 2022, the government spent $1.22 trillion on social security, $914 billion on health, $865 billion on income security, $767 billion on national defense, $755 billion on Medicare, and $1.75 trillion on all other spending. Those numbers dwarf the ~$100 billion that the Treasury would have gotten from the Fed.
Debt to GDP
If the Treasury thesis doesn't play out, bulls will likely revert back to the U.S. debt-to-GDP theory, where the Fed must pivot in order to get U.S. debt under control. The Fed could do this by lowering interest rates. This would make it cheaper for the government to borrow money and pay back its debt, which could help to reduce the burden of debt on the economy and improve the debt-to-GDP ratio.
Bears may argue that modern monetary theory (MMT) suggests that debt is not a problem, so there is no need for a Fed pivot even if debt grows faster than GDP. However, this perspective has negative consequences, such as the need to run government deficits and offshore manufacturing and jobs in order to provide the necessary dollars to the world, as the U.S. has done since 1973. In reality, using high levels of debt increases GDP in the short to medium term, but bankrupts the country in the long term.
John Maynard Keynes' theory was slightly different from the current implementation of MMT. Keynes said that debt should be used to spur economic activity in recession, but after the recession is over, the debt should be paid off. MMT misses the "pay off the debt" part of Keynes' theory.
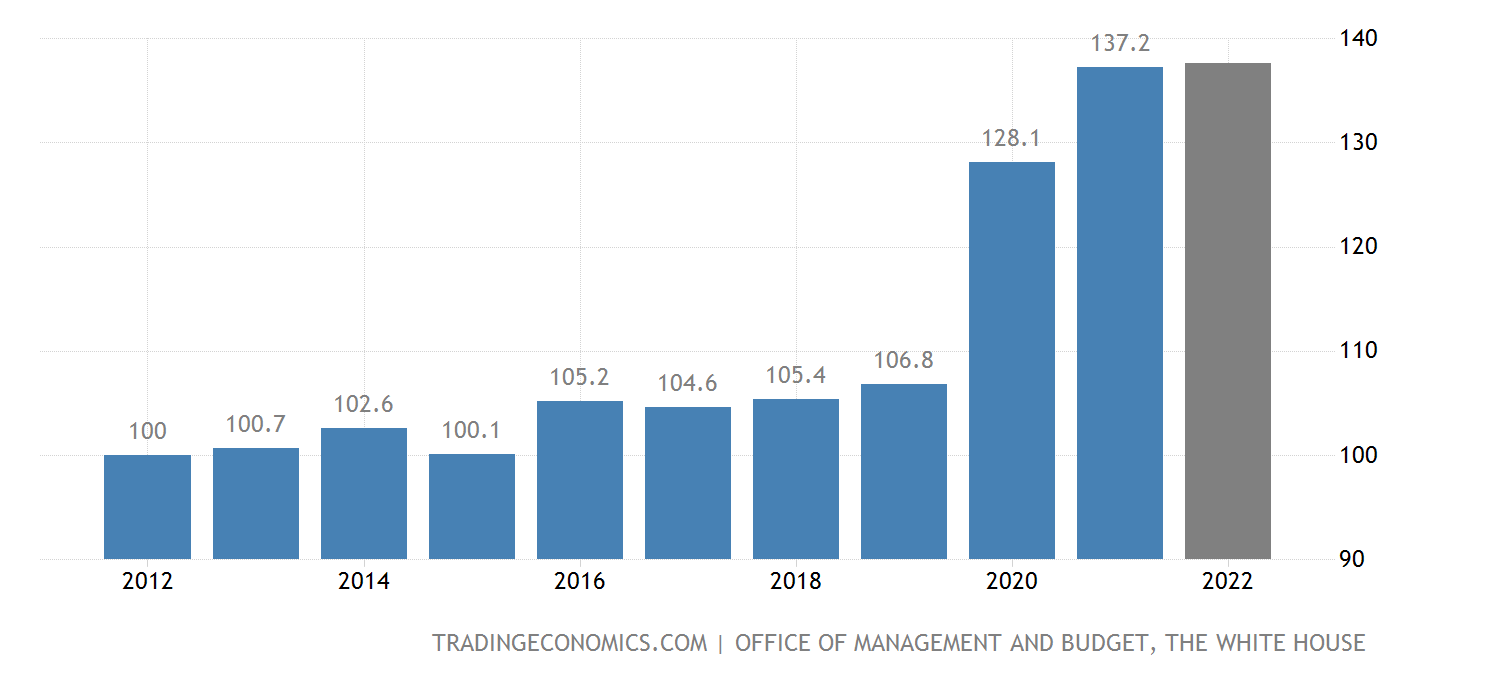
Government debt-to-GDP in the United States is expected to reach 138.10% of GDP by the end of 2022. As we can see in Figure 4, debt-to-GDP rose sharply after the Covid-19 pandemic.
A recent report by the University of Pennsylvania Wharton School of Business projected that the U.S. government will have a long-term budget deficit, meaning that its expenses are expected to consistently exceed its income. This deficit is estimated to be about 10% of the country's total economic output in the future, based on current laws and policies. As a result, the federal government's debt is projected to reach 236% of GDP by 2050, and to exceed 800% of GDP by 2095. This means that the debt would be more than eight times the size of the economy.
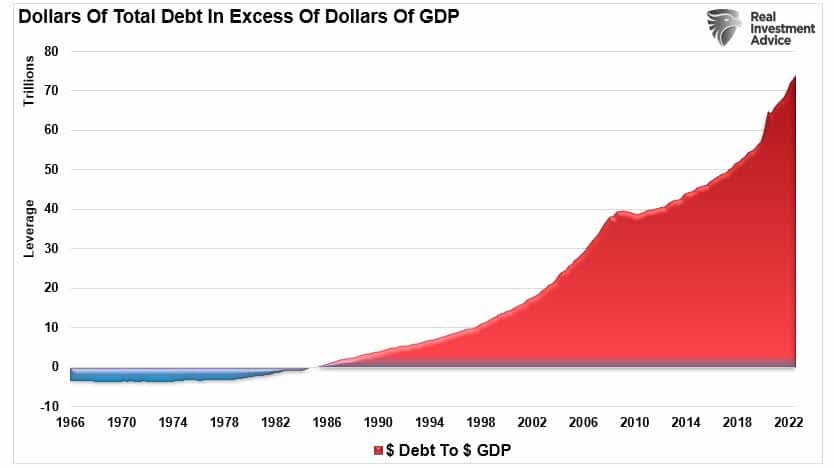
As we see in Figure 5, it currently requires more than $70 Trillion in debt to sustain the economy. Before 1982, the economy grew faster than the debt.
The U.S. can continue to issue debt as long as:
- Interest rates are low enough to promote borrowing.
- There are buyers of the debt. Institutions and individuals need to continue to believe that there is no risk of default.
But interest rates are high, so who will buy bonds?
Who Will Buy Bonds?
High interest rates tend to decrease the number of borrowers and make it more difficult for debt buyers to purchase securities at lower prices. This is particularly important because a lack of bond buyers can make it challenging for the government to fund its spending through the issuance of new debt. Treasury Secretary Janet Yellen recently spoke about this issue as a concern:
"We are worried about a loss of adequate liquidity in the [bond] market."
The issue is that the amount of Treasury debt has significantly increased by $7 trillion since 2019. At the same time, the major financial institutions, which typically act as buyers of this debt, are currently not buying. This is because, for the last decade, the Fed was a willing buyer of these bonds, but it is no longer buying. This greatly reduces the liquidity of the bond market.
To remedy the situation, the Treasury is already planning to buy bonds. (But if the Fed has no profits to remit, where will the Treasury get the money? Borrowing...) This will make major institutions more likely to buy treasuries as they will be more liquid.
What is the Fed Waiting For?
While there are some indicators of weakness in the financial markets, they are not important enough for the Fed to pivot. This was noted in the meeting minutes of the FOMC:
"Several participants noted that, particularly in the current highly uncertain global economic and financial environment, it would be important to calibrate the pace of further policy tightening with the aim of mitigating the risk of significant adverse effects on the economic outlook."
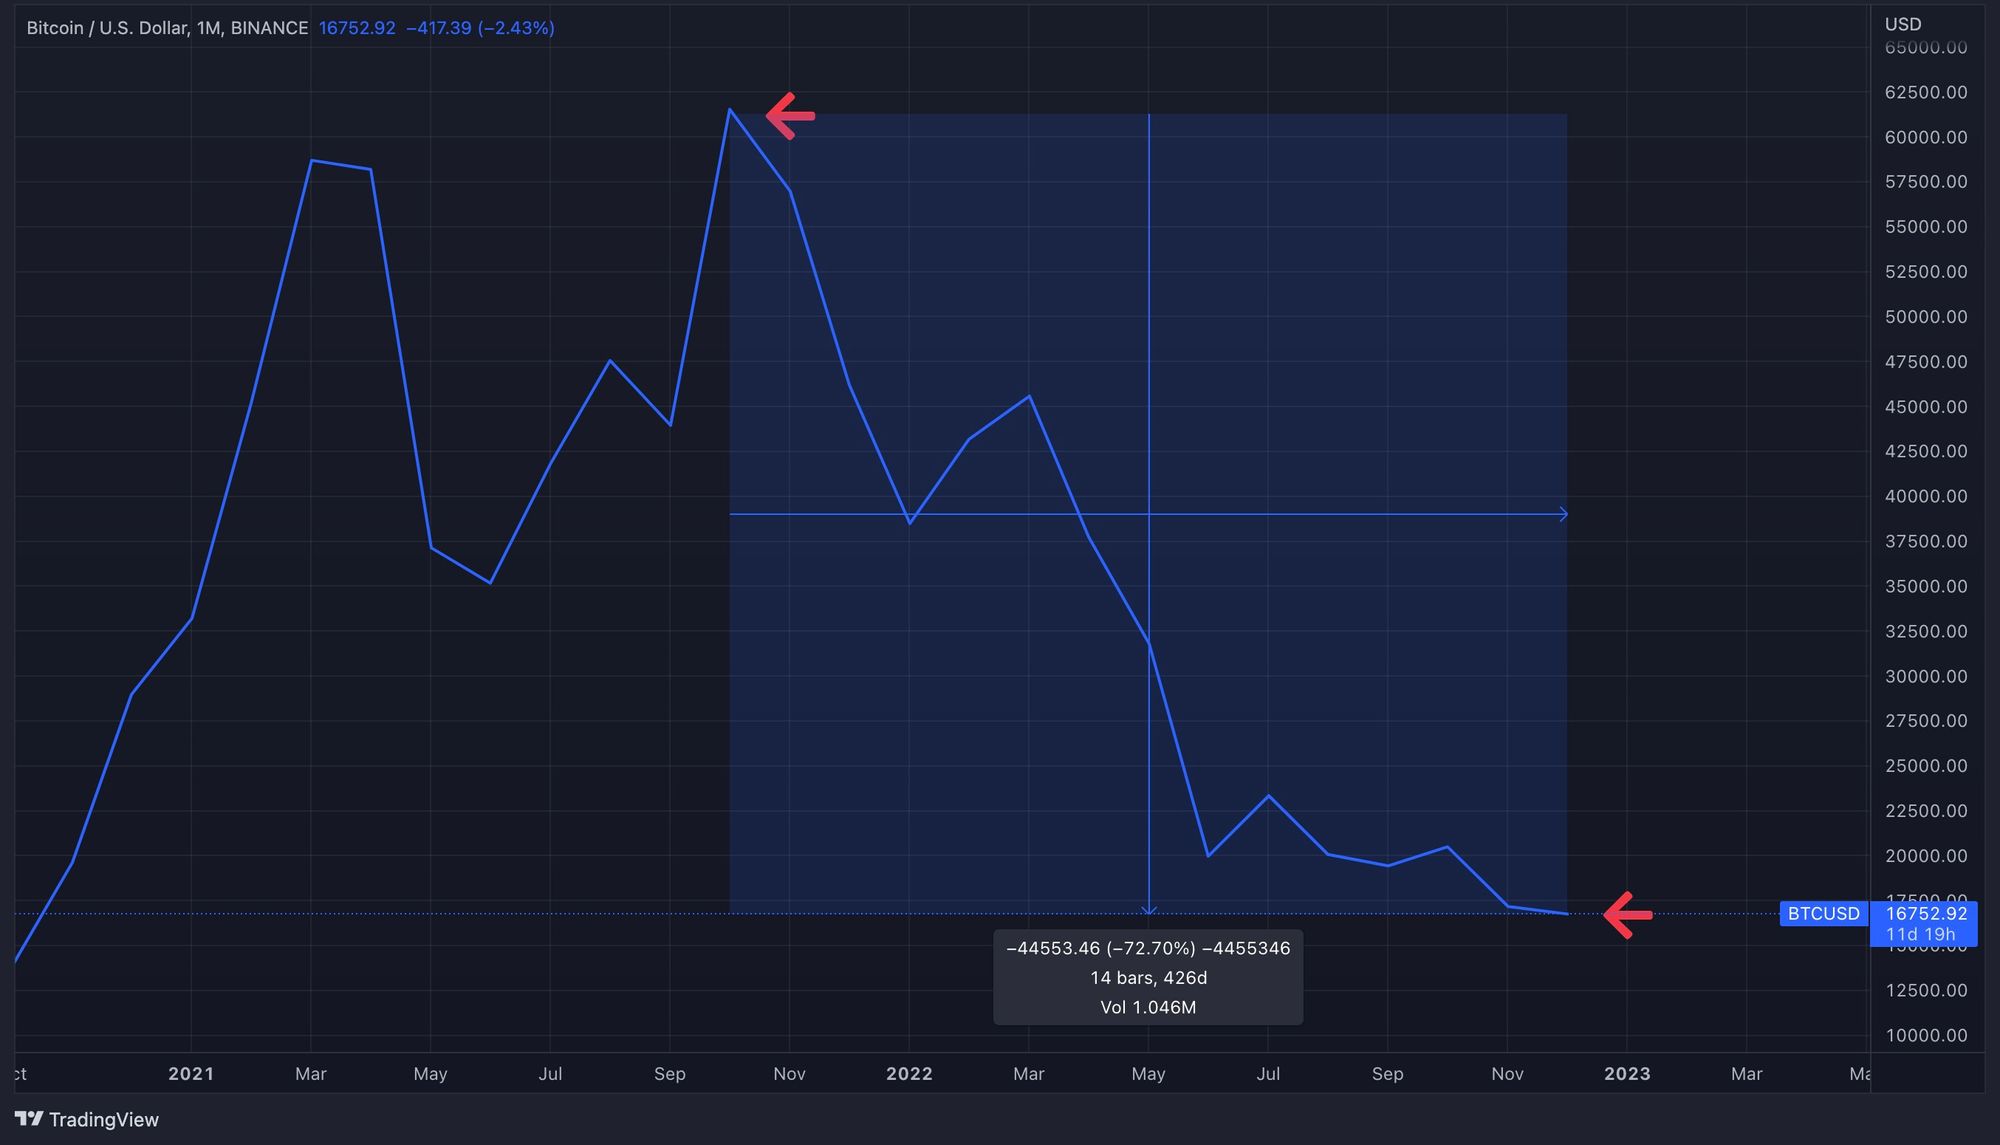
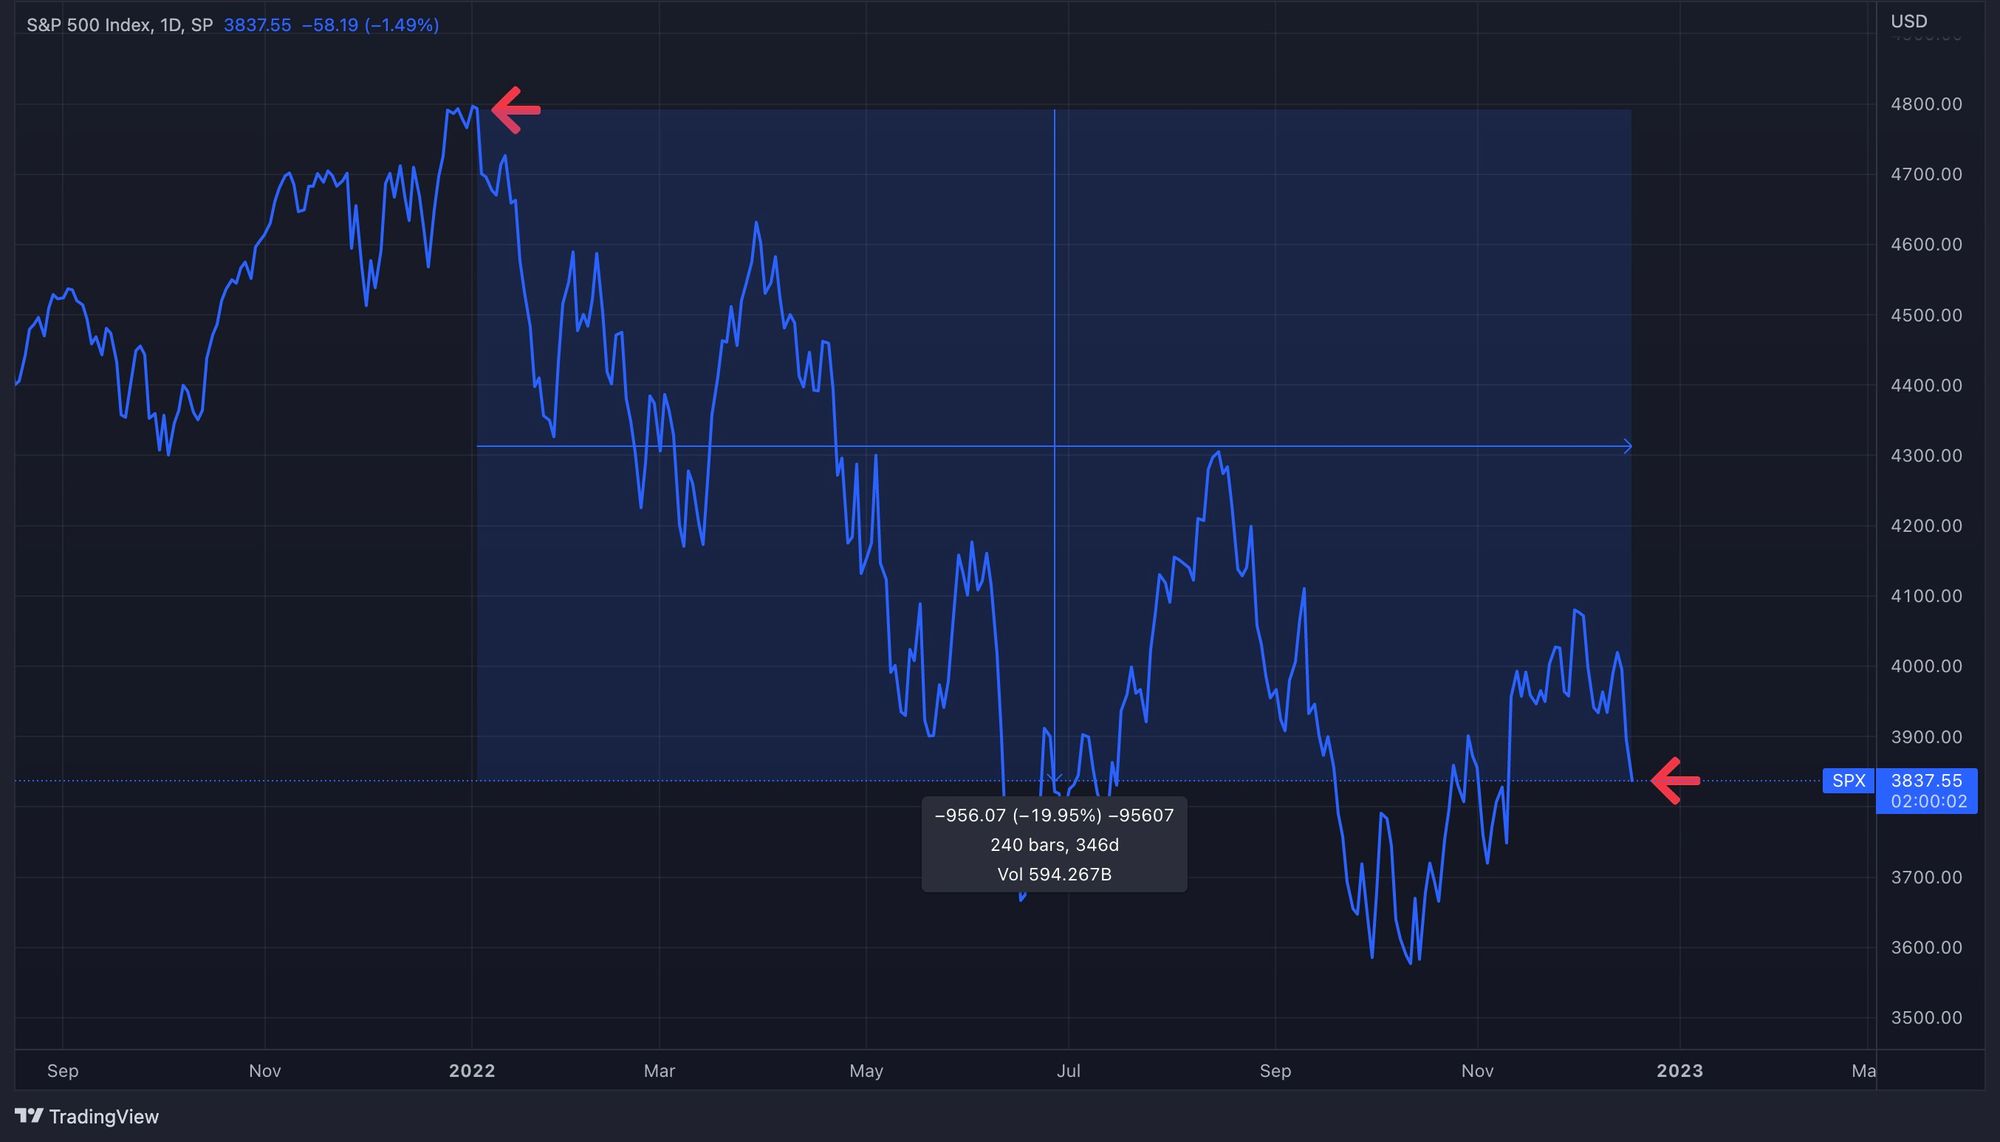
The crypto market has been decimated, as shown in Figure 6, but the Fed doesn't care about that. The stock market has also fallen precipitously (Figure 7), but the Fed doesn't care about that either. However, a recession, labor market crisis, or a credit market crisis would cause the Fed to pivot.
Did the Fed Already Pivot?
By some analysts' definitions, the Fed already has pivoted. These analysts would define a pivot as reducing the size of rate hikes and a "U-turn" as the Fed switching to rate cuts. Other analysts have a strict definition of a pivot, which is a switch to interest rate cuts instead of smaller rate hikes. For this article, we'll use this strict definition of a pivot.
In the December 14, 2022 FOMC meeting, Jerome Powell, the chair of the Federal Reserve, announced a 50 bp rate hike, down from the 75 bp hike from the previous meeting.
The bond market is currently pricing in a 72.9% chance that the Fed will reduce its next rate hike to 25 bp at the next FOMC meeting in February. This would mean a second consecutive reduction in rate hikes.
Michael Gapen, an economist at Bank of America, anticipates that the Fed will raise interest rates by another 50 bps in December, 50 bps in February, and 25 bps in March 2023 to reach a terminal rate range of between 5% and 5.25%.
Gapen predicts that there will be a bad recession in the first half of 2023 and the Fed will pivot in December 2023.
Jan Szilagyi, the CEO of Toggle, says that there is usually a 9-12 month period between the last rate hike and the first rate cut. (In this case, that would be an estimated Q4 2023 or Q1 2024 pivot.) That's because as the Fed continues to hike rates, each hike takes roughly 9-months to work its way through the economy. Therefore, the rate hikes from March 2020 won’t show up in the economic data until December. Likewise, the Fed’s subsequent and more aggressive rate hikes won’t be fully reflected in the economic data until the first half of 2023. As the Fed hikes at subsequent meetings, those hikes will continue to compound their effect but won't immediately show up in the data.
The Fed will continue to hike rates because it uses lagging indicators. An analysis of real-time economic indicators would suggest the transition from an economic slowdown to a recession.
What Indicators is the Fed Watching?
Before we look at real-time macro indicators, we'll go over the indicators that the Fed and Jerome Powell, the chair of the Fed, follow:
- Consumer Price Index (CPI). A monthly report that measures the change in price for a selection of goods and services that are typically purchased by consumers. It is produced by the U.S. Department of Labor's Bureau of Labor Statistics and can provide the Federal Reserve (Fed) with a reliable measure of inflation by tracking the rate of change in the CPI. The CPI reflects the cost of a fixed basket of items that a typical consumer might purchase over a given period of time.
- Real Gross Domestic Product (GDP). A measure of the total output of goods produced within the United States, regardless of the nationality of the producers or who owns the goods. It is calculated on a quarterly basis and is considered a reliable indicator of the country's economic performance and growth. The GDP is expressed in real terms, which means that it takes into account inflation and adjusts the numbers accordingly to provide an accurate representation of national output.
- Housing Starts. A key economic indicator that reflects the level of activity in the housing market. They are an estimate of the number of new residential construction projects that began in a given period and are considered an important factor in determining the health of the housing market. The Federal Open Market Committee (FOMC) may pay particular attention to housing starts, as they can be sensitive to changes in interest rates and can provide insight into how financial conditions are affecting consumers. Housing starts are reported on a monthly basis.
- Nonfarm Payroll Employment. A measure of the total number of payroll jobs in the U.S. that are not related to the farming industry. It is compiled monthly by the U.S. Department of Labor's Bureau of Labor Statistics and includes data on the total number of hours worked and the hourly wages earned by workers. The Federal Open Market Committee (FOMC) may use this indicator as a way to assess the pace of economic growth and to identify trends in supply and demand. Nonfarm payroll employment can provide valuable insights into the overall health of the labor market and the overall economy.
- S&P 500 Index. A widely used stock market index that tracks the performance of 500 large publicly traded companies in the U.S. The index is compiled daily by S&P and can be used as an indicator of the overall health of the economy. The Federal Open Market Committee (FOMC) may pay attention to the S&P 500 as a way to gauge consumer and business confidence in the economy. If the index is rising, it can indicate that investments and spending are also on the rise, while a declining or low market may signal a slowdown in investments and spending.
- Industrial Production and Capacity Utilization. An economic indicator that measures the output of goods and services produced by the manufacturing, mining, and utilities sectors of the economy. It is compiled monthly by the Federal Reserve Board of Governors and can provide valuable insights into the current growth of the Gross Domestic Product (GDP). The Federal Open Market Committee (FOMC) may pay attention to this indicator as a way to understand how resources are being utilized and to anticipate future changes in the rate of inflation. Industrial production and capacity utilization data is typically reported by both product and industry, which can help to provide a more detailed picture of the state of the economy.
- Retail Sales. An economic indicator that reflects the total value of all merchandise sold by retail merchants in the U.S. The data is presented in dollar amounts and is adjusted for seasonal fluctuations, but not for inflation. The U.S. Department of Commerce produces a retail sales report on a monthly basis. This measurement can provide the Federal Open Market Committee (FOMC) with insight into the level of consumer spending, also known as the personal consumption expenditure, and can help to predict future growth or weakness in the economy.
- Business Sales and Inventories. An economic indicator that reflects the total sales and inventory levels for the manufacturing, wholesale, and retail sectors of the economy. The data is compiled monthly by the U.S. Department of Commerce and can provide the Federal Open Market Committee (FOMC) with insight into the overall health of the economy. By tracking the movement of inventory, the FOMC can determine whether production is likely to increase or slow down in the future. For example, stagnant inventory levels may indicate a slowdown in the economy, while moving inventory may signal an increase in future production.
- Light-Weight Vehicle Sales. An economic indicator that reflects the total number of light-weight vehicles (such as cars, vans, and SUVs) sold in the U.S. It is compiled by Ward's Automotive Reports and the American Automobile Manufacturer's Association, and the seasonally adjusted data is produced by the U.S. Department of Commerce and the Bureau of Economic Affairs. Changes in light-weight vehicle sales can significantly impact the Gross Domestic Product (GDP) from quarter to quarter, making this measurement an important factor for the Federal Open Market Committee (FOMC) to consider.
- 10-year Treasury Bond Yield. A measure of the current market rate for these bonds, which are set to mature in 10 years. This yield is often used as an economic indicator because mortgage rates tend to follow it. As such, changes in the yield on 10-year Treasury bonds can provide insight into future changes in the housing market, as changes in mortgage rates can impact the demand for housing. The Federal Open Market Committee (FOMC) may pay attention to the yield on 10-year Treasury bonds as a way to gauge the overall health of the housing market.
- M2. An economic indicator that reflects the supply of money in the economy. It is composed of a variety of assets, including cash, checking and savings deposits, and money market securities. The Federal Open Market Committee (FOMC) may pay attention to M2 as a way to gauge the potential impact of the supply of money on economic growth. This indicator is produced by the Federal Reserve Board of Governors on a weekly and monthly basis.
Jerome Powell Indicators
Jerome Powell has a few favorite macro indicators:
- Consumer Price Index (CPI). CPI is Jerome Powell's top economic indicator.
- The University of Michigan survey of inflation expectations. A survey that measures the expectations of consumers and analysts about future inflation. It is conducted by the University of Michigan's Survey Research Center and is released on a regular basis, typically monthly or quarterly. The survey asks respondents about their expectations for future price changes for a variety of goods and services, including food, housing, transportation, and healthcare. The survey results can provide insight into the public's perceptions of inflation and can be used by policymakers, including the Federal Reserve, to gauge the outlook for future inflation and to inform monetary policy decisions.
- Fed Index of common inflation expectations. A survey conducted by the Federal Reserve Bank of Philadelphia that measures the inflation expectations of professional economists and analysts. It is released on a quarterly basis and asks respondents to provide their forecasts for various measures of inflation, including the Consumer Price Index (CPI), over different time horizons. The results of the SPF can provide the Federal Reserve with valuable information about the outlook for future inflation and can be used to inform monetary policy decisions. Like the CPI, the SPF aims to capture changes in the cost of a selection of goods and services that are typically purchased by consumers. However, the SPF reflects the expectations of professional forecasters rather than the actual changes in prices measured by the CPI.
- Ratio of job openings to unemployed workers. A measure of the availability of job opportunities in the economy. It is calculated by dividing the number of job openings, which is a measure of the demand for labor, by the number of unemployed workers, which is a measure of the supply of labor. A high ratio indicates that there are more job openings than unemployed workers, potentially indicating a tight labor market with strong demand for workers. A low ratio, on the other hand, indicates that there are more unemployed workers than job openings, potentially indicating a weak labor market with excess supply of workers. The ratio of job openings to unemployed workers is often used as an indicator of the health of the labor market and can be used to inform policy decisions related to employment and the economy.
- Employment Cost Index (ECI). A measure of the change in the cost of labor for businesses in the United States. It is produced by the U.S. Department of Labor's Bureau of Labor Statistics and is released on a quarterly basis. The ECI measures the change in the total cost of labor for businesses, including both wages and benefits, over a given period of time. It is based on a sample of private and public sector employers and covers a wide range of occupations and industries. The ECI is often used as a measure of labor market conditions and can provide insight into trends in wage growth and the overall cost of labor for businesses. It can also be used by policymakers, including the Federal Reserve, to inform decisions related to employment and the economy.
What is the Fed's Job?
The Fed has 2 key objectives:
- Keep inflation low.
- Maximize employment.
According to Wharton Business School Professor Jeremy Siegel, virtually all indicators show that inflation is falling, so what's stopping the Fed from pivoting? Why is the Fed continuing to increase the unemployment rate?
There are 3 things that the Fed wants to see before it pivots:
- Inflation. The Fed wants the CPI reports to show decreasing inflation.
- Housing. The Fed wants the housing reports to show falling inflation.
- Employment. The Fed wants the Current Employment Statistics (CES) reports to show a decrease in job growth.
We'll analyze 3 different reports to see how the Fed's indicators hold up.
Inflation
Goods inflation can be measured by the Consumer Price Index (CPI) report. Figure 8 shows the trailing twelve month percent changes have been decreasing since July 2022.
Housing
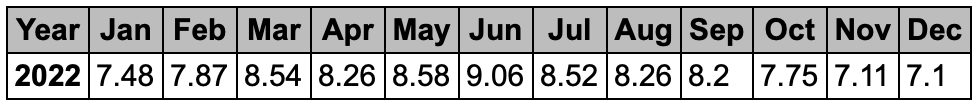
The Fed looks at many sources of housing data including housing starts, home sales, mortgage rates, home builder confidence, housing affordability, and housing inventory. But Wharton professor Jeremy Siegel recommends looking at the Case Shiller housing index, and says that the housing indicators the Fed is following are incorrect. The Case Shiller index can be used as an indicator for housing prices in the U.S. and Figure 9 shows it trending downwards.
Employment
The Fed has a mandate to promote maximum employment, so if inflation is going away, why is the Fed continuing to hurt the labor market? It's because the Fed is looking at incorrect data. On December 13, 2022, the Philadelphia Fed released a report stating that the U.S. Bureau of Labor Statistics (BLS) significantly overestimated the number of new jobs added during the period. The BLS estimated net growth of 1,047,000 jobs from March through June 2022, while the Philadelphia Fed's analysis found that only 10,500 net new jobs were added. This poor performance in the labor market suggests a higher likelihood of a recession and may prompt a Fed pivot.
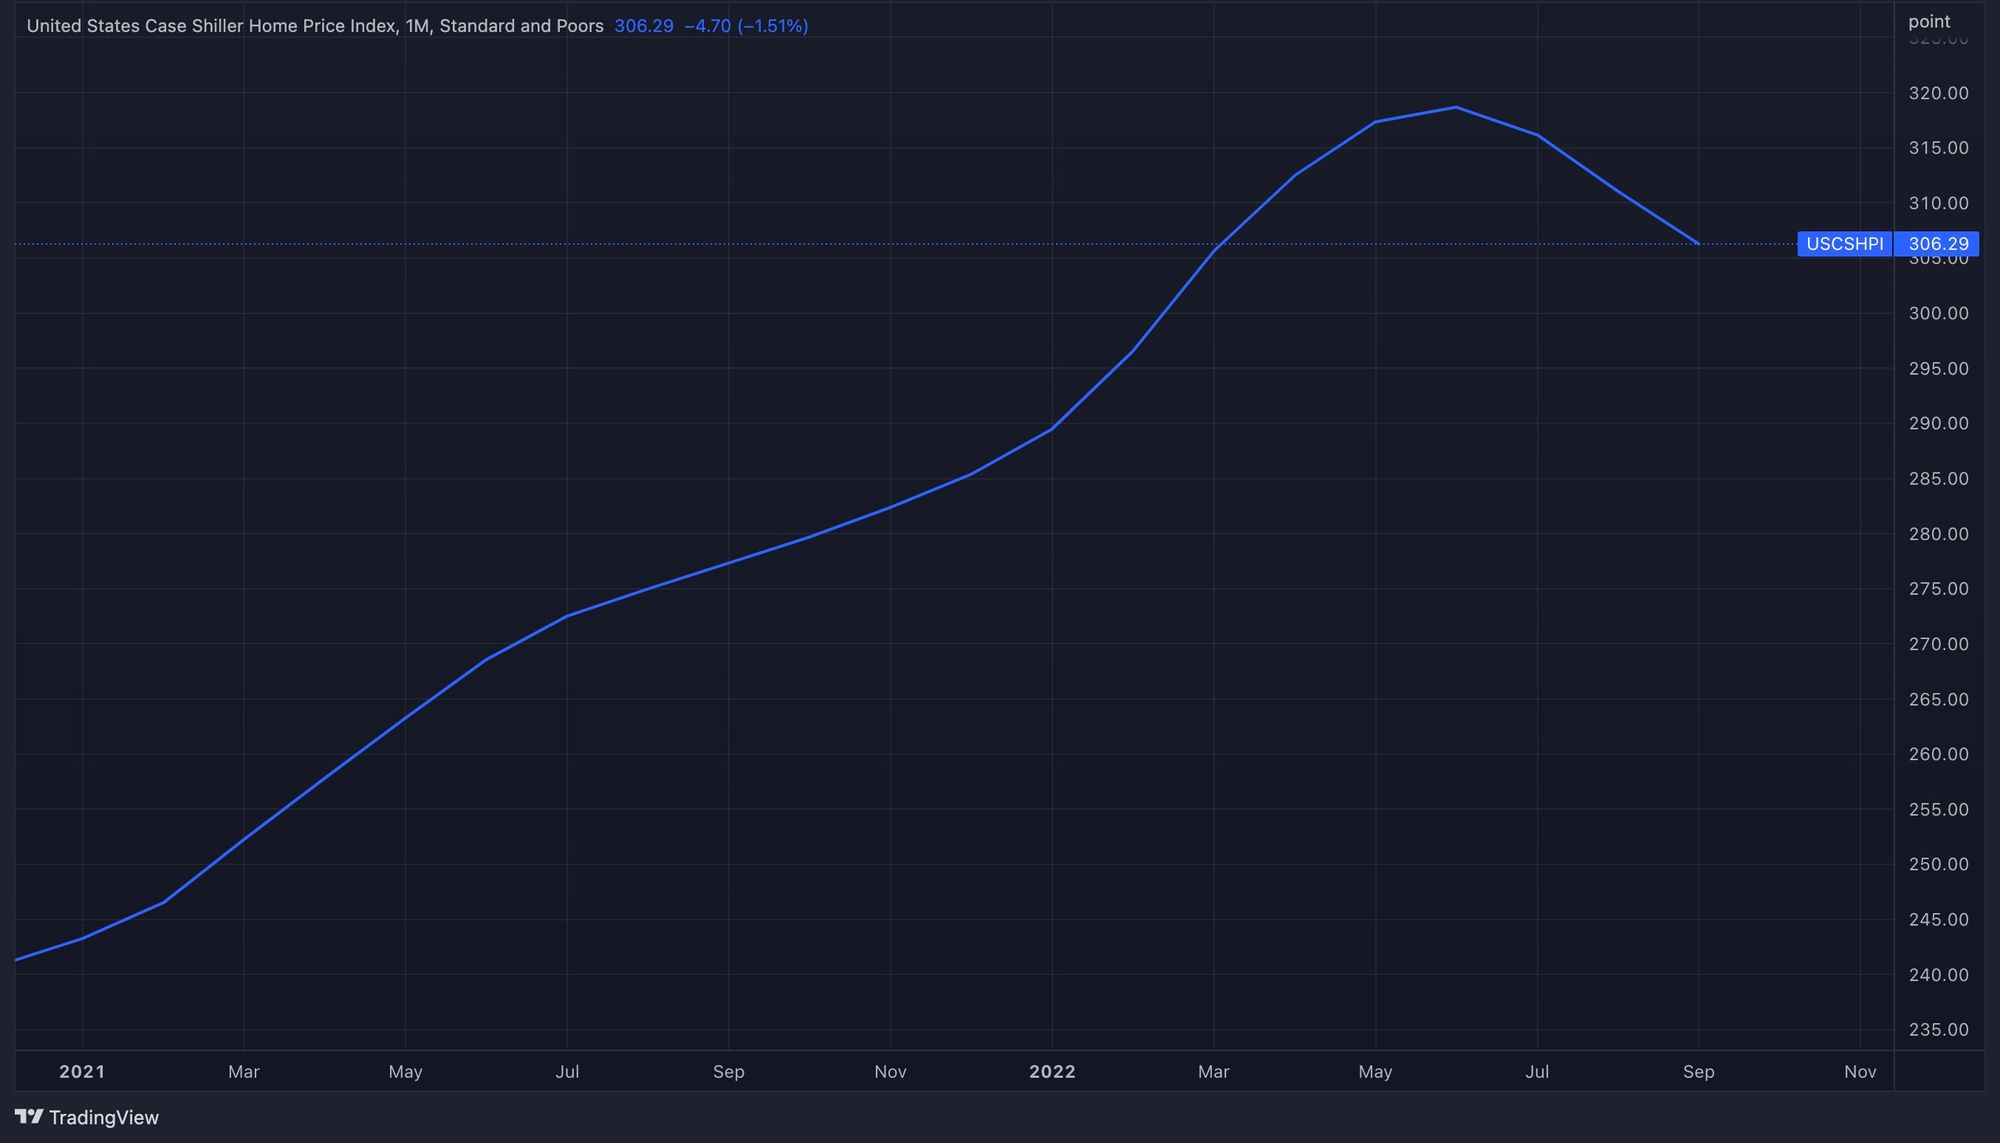
The Fed is (incorrectly) using the numbers from the Establishment Survey in Figure 10 to justify its aggressive rate hikes. The Establishment Survey shows growth of ~2.7 million jobs while the household survey (which is closer to the actual numbers) shows growth of ~12,000 jobs. That's a big difference.
The difference between the Establishment Survey and the Household Survey could be due to several factors:
- Seasonal adjustments, which aim to account for regular fluctuations in employment due to weather or holidays, may introduce error if not applied correctly.
- Birth-Death assumptions, which estimate the number of new businesses that have been created or have gone out of business during the survey period, may not accurately reflect current economic conditions.
- High rates of estimation, which involve using statistical techniques to estimate the number of jobs in industries or geographic areas with low survey response rates, may introduce error if estimates are not based on a representative sample.
- Political interference. It looks better for an administration if the labor market is strong during its term, which could incentivize estimates to be skewed upwards.
Is a Fed Pivot Bullish?
Not necessarily, most bear markets occur AFTER a Fed pivot. This is because the Fed typically only pivots when something breaks, like a recession or a credit market crisis. When that happens, the Fed pivots and the stock market reprices for lower growth rates. The crypto and real estate markets would likely also trend downwards.
What is a Recession?
Concerns about a recession began when the stock market crashed and there were two consecutive quarters of negative GDP growth in the first half of 2022.
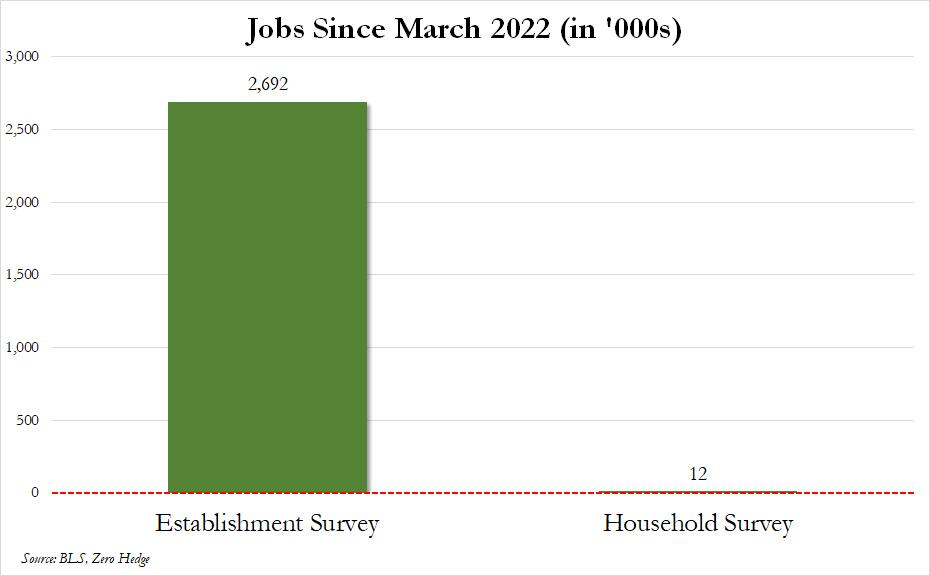
It is unusual for the S&P 500 index to fall by more than 20% without the economy either already being in a recession or being close to one. However, as shown in Figure 11, the S&P 500 did decline by more than 20% in July 2022 but it has not yet resulted in a recession.
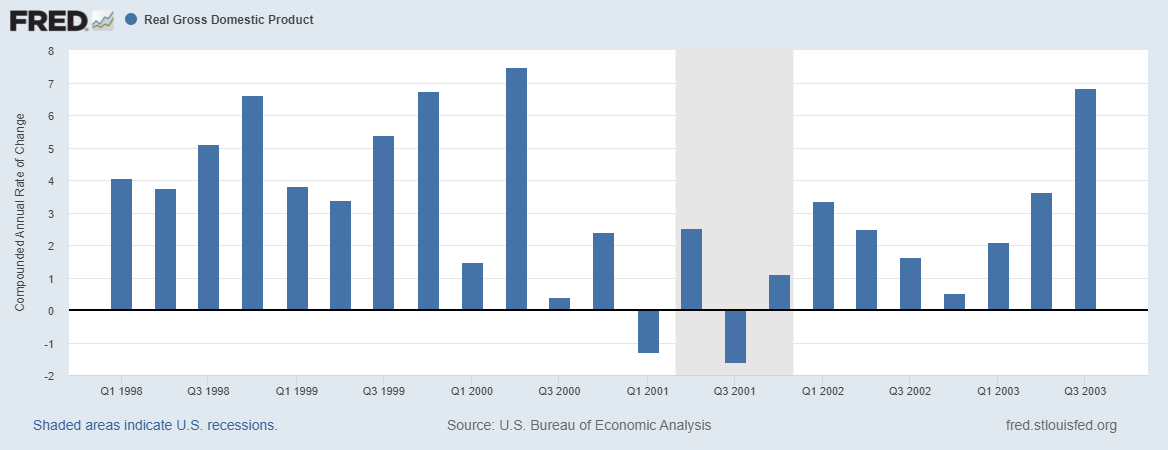
Contrary to popular belief, a recession is not necessarily indicated by two consecutive quarters of negative real GDP growth. This can be seen in the 2001 recession (Figure 12), when real GDP was negative for a total of two months (not for two consecutive quarters) and the National Bureau of Economic Research (NBER) still declared it a recession.
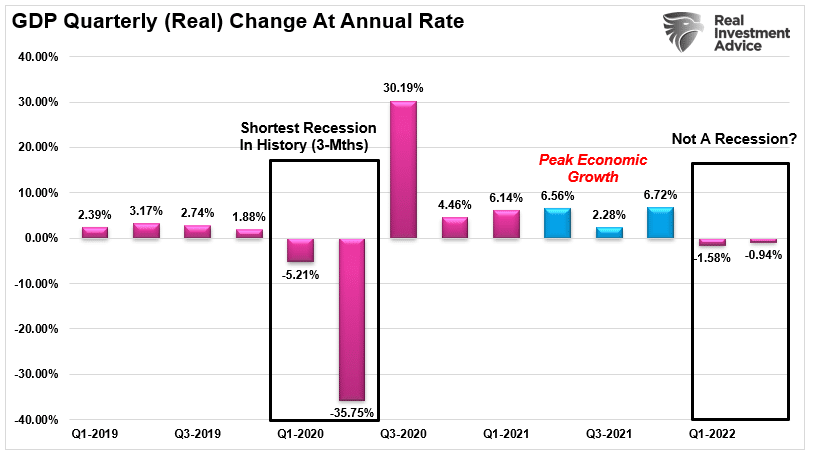
When we look at the degree to which GDP fell, in Figure 15, we can see that the change in GDP in Q1 and Q2 2022 was nowhere near as drastic as the recession in the first half of 2020.
If a recession is not simply defined as 2 consecutive quarters of negative real GDP, then what is it? The NBER defines a recession as a:
"Significant decline in economic activity that is spread across the economy and that lasts more than a few months."
Real GDP is often used as an indicator of economic activity because it captures many aspects of the economy, but it does not take into account income. Real GDI, on the other hand, measures the economy from the perspective of income, and there is often a statistical discrepancy between real GDP and real GDI. To determine the extent of the decline in economic activity, the NBER uses indicators from all sectors of the economy, such as real personal income less transfers, nonfarm payroll employment, real personal consumption expenditures, wholesale-retail sales adjusted for price changes, employment as measured by the household survey, and industrial production.
Are We in a Recession?
Currently, the U.S. economy is on a pre-recessionary path but not yet in a recession. Many analysts use the inversion of the bond yield curves as an indicator of a coming recession. The inversion of 80% of the 10 economically important yield curves suggests a recession is likely.
To dive deeper, we'll look at the NBER's top 2 recession indicators, real personal income less transfers (real income) and nonfarm payroll employment (employment growth).
In recent decades, the two measures we have put the most weight on are real personal income less transfers and nonfarm payroll employment. – NBER
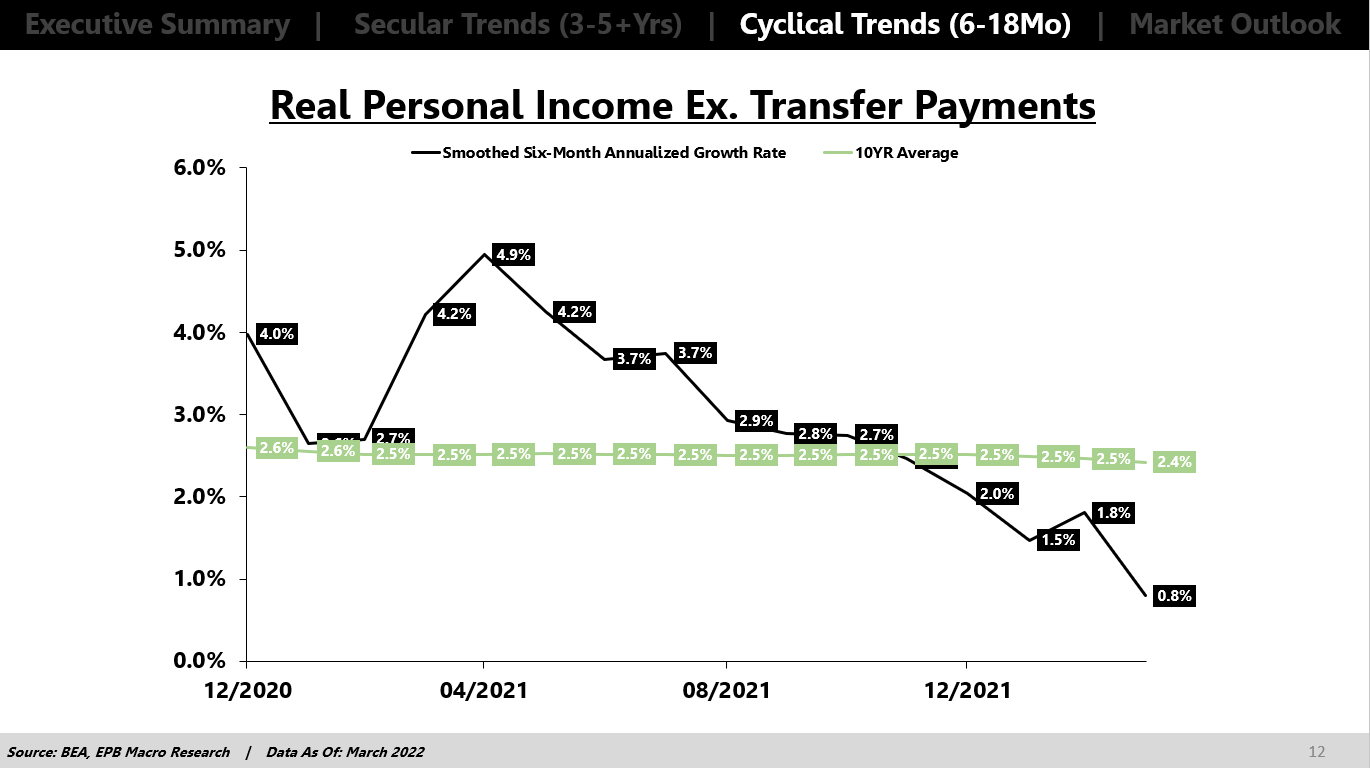
Real Income
In Figure 14, we can see that real income has been recessionary since March 2022.
Employment Growth
According to a May 2022 report by macro analyst Eric Basmajian, employment growth was too strong for the economy to be in a recession.
The government is also telling us there is an economic slowdown but no recession:
“We’re not in a recession right now. We do have these two-quarters of negative GDP growth. To some extent, a recession is in the eyes of the beholder. With all the job growth in the first half of the year, it’s hard to say there’s a recession. With a flat unemployment rate at 3.6%, it’s hard to say there’s a recession.” – James Bullard, St. Louis Federal Reserve President
But as we learned earlier, the Philadelphia Fed report invalidated the BLS data that Basmajian and the government use and we may be closer to a recession than we initially thought.
How Bad Could a Recession Get?
There are two camps on the recession. One group believes that the recession will be severe and last until 2025, while the other thinks it could be shorter and less severe.
- Danielle Dimartino Booth and Chamath Palihapitiya, among other analysts, have argued that the Federal Reserve will not pivot anytime soon and the recession could last until 2025. They advise individuals and CEOs to prepare for the worst-case scenario of prolonged economic downturn.
- On the other hand, analysts such as Jeremy Siegel and James Mullarney believe that the Fed is using flawed indicators and should pivot aggressively. If it does, we may experience a "soft landing," meaning a relatively mild recession.
Are Recessions Bad?
Recessions can be devastating to certain individuals and businesses that are unprepared for them, but from a macroeconomic perspective, recessions are a necessary and even beneficial part of the economic cycle. They help to eliminate excesses that have accumulated during the expansion phase and set the stage for the next phase of economic growth. If recessions are not allowed to occur, excesses can build up until something breaks.
The Federal Reserve's efforts to maintain low interest rates for an extended period have allowed some fundamentally weak companies to remain in business by taking on cheap debt for unproductive purposes, like stock buybacks and dividends. Consumers have also taken on debt to increase consumption. Meanwhile, the government has increased its debt and deficits to record levels.
It currently takes $4.82 of debt to generate each dollar of inflation-adjusted economic growth. In recent decades, the system has not been allowed to reset, leading to a build-up of debt that is impeding economic growth. After years of accommodative policies following the financial crisis, most of the potential for using debt to consume has likely been exhausted. This problem cannot be solved by simply issuing more debt, which is what the government has done for the past 40 years. It can only be solved by a recession.
How to Invest in this Economy
The remainder of this article is for paid Insider Investor subscribers only. It discusses the timing of the Federal Reserve's pivot, the potential impacts on the bond, stock, cryptocurrency, and real estate markets, and suggests appropriate assets to purchase based on these factors.