Investing in a Nutshell
The big money is made from buying high-quality assets during a crash.
The big money is made from buying high-quality assets during a crash.
Disclaimer: None of the following is financial advice.
Personal Finance Basics
- Spend less than you make.
- Invest for the long-term (5–10 years).
How to start investing:
1. Thoroughly research and pick 2–4 equities and cryptocurrencies that you think will go up in value.
- I recommend looking into Tesla (TSLA), Google (GOOG), Bitcoin (BTC), and Ethereum (ETH).
2. Dollar cost average (DCA) into your top 2–4 equities and cryptos over a 6 month time frame.
3. DCA until you have 20% in cash and 80% in investments.
4. Wait for a market dip/crash.
5. Buy the dip with your cash.
6. Every time you get more money, wait for a dip and buy more assets.
Macroeconomics
There are two important economic factors: (1) money supply and (2) production.
Money supply = the total amount of a currency. This can be altered by a central bank printing money.
Production = citizens making products and services.
All of the relevant metrics that people use are proxies for these two economic factors. Ex) Employment statistics and GDP are proxies for production.
Too much money printing and too much unemployment is bad.
Low money printing and high employment is good.
Low interest rates = people buy riskier assets (growth stocks, crypto).
High interest rates = people buy less risky assets (bonds, value stocks) because they provide good returns at low risk.
Fundamentals
- Read 10-K and 10-Q reports (mainly: assets, liabilities, revenue, net income)
- Understand cash flows
- How good is the product/service?
- What is the demand for product/service?
- What is the roadmap/narrative?
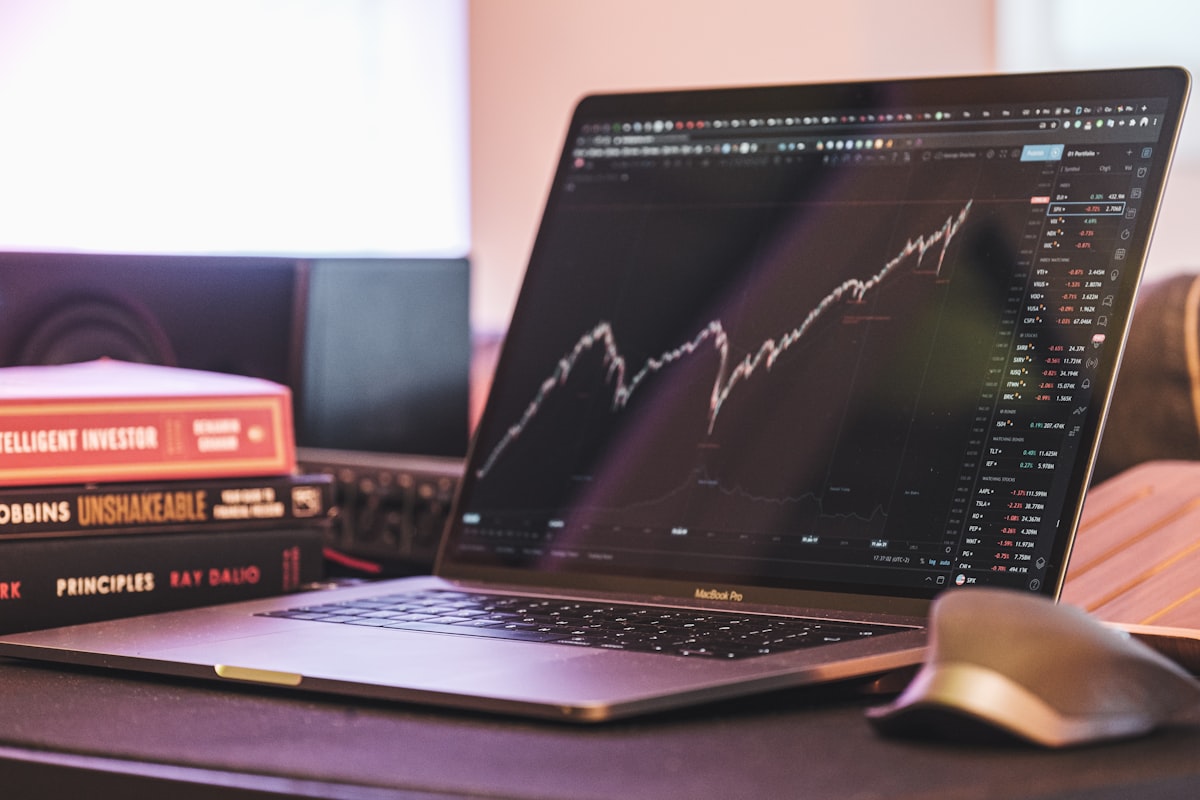
Technical Analysis
All of these indicators are used as signals for when to buy or sell an asset. You typically want multiple indicators to confirm before you buy or sell.
My most used indicators: Bollinger bands, RSI, and MACD.
Other than the standard price charts, my most used charts are percentage comparison charts (comparing the gain or loss of 2+ assets).
My most used tools are: (1) trend lines and (2) date and price range.
Mega Political Risk
Understand the risks of:
- Disruption (new technology, exponential improvement)
- Economic depression
- Terrorism
- Political instability
- Debt/Market cycles
- Black swans (Ex. 9/11 attack)
Strategy
Examples:
- Long-term hold
- Options
- Day trading
- Momentum investing
- Venture capital
- Angel investing
- Arbitrage
- Alpha
Software Tools
Technical Analysis: Trading View
Business fundamentals website: Qualtrim, Hyper Charts
Buy/sell/swap crypto: FTX.US, Coinbase Pro, or Uniswap.
Buy/sell stocks: Charles Schwab or Cash App (for stock slices).

Comments ()