How to Code a Trading Bot that Returns 214x Bitcoin Buy&Hold
This algorithmic trading strategy backtested an annualized return of 168%. With leverage, its annualized return was 252%.

Introduction
For this project, we will use Freqtrade, an open-source cryptocurrency trading bot written in Python. It supports all of the major crypto exchanges and has easy backtesting and plotting. Read the Freqtrade installation documentation to get Freqtrade set up on your system (or watch this video tutorial) and then return to this article.
Tools needed:
- Visual Studio Code (or other IDE)
- Docker
- Telegram
- Freqtrade
- A supported crypto exchange account (Coinbase, Binance) & API key
Trading Strategy
In August 2022, the crypto quant investor Plan B released a trading strategy that backtested 10x buy-and-hold outperformance, an annualized return of 168%, and less risk (a drawdown of 57%).
This is the strategy in simple terms:
- IF (RSI was above 90% last six months AND drops below 65%) THEN sell,
- IF (RSI was below 50% last six months AND jumps +2% from the low) THEN buy, ELSE hold.
How do we code this strategy in Python while following the Freqtrade documentation?
Coding
This is the Python code that can be copied & pasted into a Freqtrade trading strategy file:
def rsi_strategy(dataframe: DataFrame) -> DataFrame:
    six_month_ago = dataframe.index.max() - pd.Timedelta(days=180)
    rsi_last_six_months = dataframe.loc[six_month_ago:].rsi
    if rsi_last_six_months.max() > 90 and rsi_last_six_months.iloc[-1] < 65:
        return "sell"
    elif rsi_last_six_months.min() < 50 and rsi_last_six_months.iloc[-1] > rsi_last_six_months.min() + 2:
        return "buy"
    else:
        return "hold"
This code defines a function rsi_strategy that takes in a dataframe of historical OHLCV data and returns a "buy", "sell", or "hold" signal based on the conditions specified in the prompt. The function first calculates the RSI values of the data over the last six months using the rsi method of the dataframe. It then checks the conditions specified in the prompt to decide whether to return a "buy", "sell", or "hold" signal.
Where do I paste this code into Freqtrade?
To use this strategy in Freqtrade, you can add the code above to a new file in the user_data/strategies directory. The file should be named something like rsi_strategy.py, and it should contain a class that extends the BaseStrategy class from Freqtrade. Here is an example of how the file might look:
from freqtrade.strategy.interface import IStrategy
from pandas import DataFrame


class RSIStrategy(IStrategy):

    def populate_indicators(self, dataframe: DataFrame, metadata: dict) -> DataFrame:
        # Add your indicator calculations here
        dataframe['rsi'] = self.talib.RSI(dataframe)

        return dataframe

    def populate_buy_trend(self, dataframe: DataFrame, metadata: dict) -> DataFrame:
        # Use the rsi_strategy function defined above to generate
        # buy signals based on the RSI of the data
        dataframe['buy'] = dataframe.apply(rsi_strategy, axis=1)

        return dataframe

    def populate_sell_trend(self, dataframe: DataFrame, metadata: dict) -> DataFrame:
        # Use the rsi_strategy function defined above to generate
        # sell signals based on the RSI of the data
        dataframe['sell'] = dataframe.apply(rsi_strategy, axis=1)

        return dataframe
Once you have added this code to a file in the user_data/strategies directory, you can use it as a strategy in Freqtrade by specifying the name of the strategy class (RSIStrategy in this example) in the strategy parameter of your user_config.json file. For example:
{
    "strategy": "RSIStrategy",
    ...
}
This will cause Freqtrade to use the RSIStrategy class you defined to generate buy and sell signals for your trades.
Returns
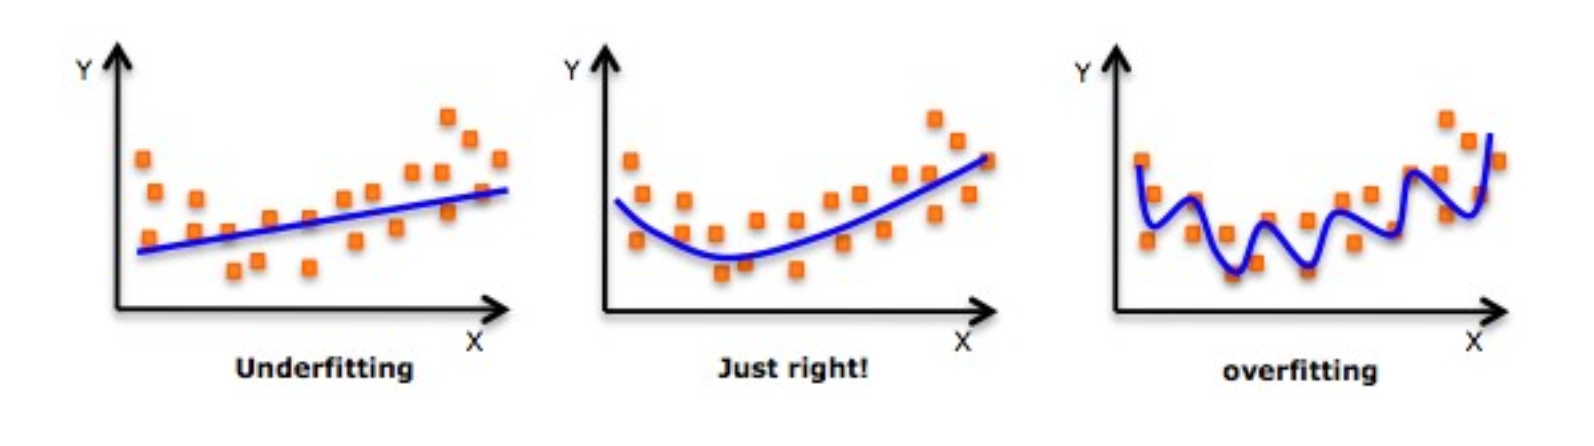
This strategy backtested an annualized return of 168%. With leverage (call options), the annualized return was 252% (214x BTC buy & hold outperformance). That does NOT mean that it will continue to perform well in the future. Plan B used multiple periods on the Calmar ratio to optimize this strategy for historic prices. It likely will not perform well in the future if it is overfitting – when an algorithm memorizes an entire dataset instead of generalizing the underlying data. Overfitting will perform extremely well in backtesting but will likely underperform with new out-of-sample data. That said, Plan B understands overfitting and if the model is "Just right!" like the center image in Figure 1, it could continue to perform well in the future.
Risks
No investment is without risk. Here is a non-exhaustive list of risks:
- A potential risk of this model is that too many people start using it because of Plan B's social media following. Or if other investors start countering the strategy with their own strategies.
- Data: the data could contain errors.
- Information: the calculation of RSI could be wrong.
- Knowledge: the correlation between RSI and BTC could be spurious.
- Wisdom: overfitting of the trading rule, the backtest could be wrong, there could be black swans and past performance is no guarantee of future results.
- Trading: there is credit risk on exchanges ("not your keys not your coins").
- Do not invest or trade more than you are willing and able to lose.
Disclosures and Disclaimers
- I own BTC and other cryptocurrencies.
- Nothing in this article is financial advice.
- All content is for informational and educational purposes only.
- Past performance is no guarantee of future results.


Comments ()